USER'S GUIDE

Published by
Moisés Gómez Mateu and
Guadalupe Gómez Melis
Department of Statistics and Operations Research.
Universitat Politècnica de Catalunya, Spain.
CompARE
Thank you for using the free on-line platform CompARE. This website will help you to:
- Analyze, based on statistical properties, whether you should use a Composite endpoint as Primary endpoint.
- Minimize Sample size in time-to-event Clinical trials.
- Compare different scenarios depending on your candidate endpoints.
- Get helpful numerical and intuitive graphical results.
This short guide will help users to run CompARE effectively. Comments are welcome (moises.gomez.mateu@upc.edu).
You can easily print this guide using the print options from your web browser and save it in pdf (click on the right button of your mouse\convert to PDF).
Alternatively, you can also use the PRINT ICON from the top-right page once you are logged in.
Table of Contents
[Show/Hide]Main concepts
Relevant, Additional and Composite endpoints
The appropriate choice of the Primary endpoint is a crucial issue at the design stage of randomized clinical trials. This choice might depend on whether a secondary endpoint has to be added so that the desired effect of a treatment is detected.
The main goal of CompARE is to help you to make a more informed decision on the Primary endpoint you should use in your Randomized Clinical Trial. From a list of candidate endpoints, you can "build" a Composite endpoint and CompARE will help you to choose between a Relevant and the Composite endpoint.
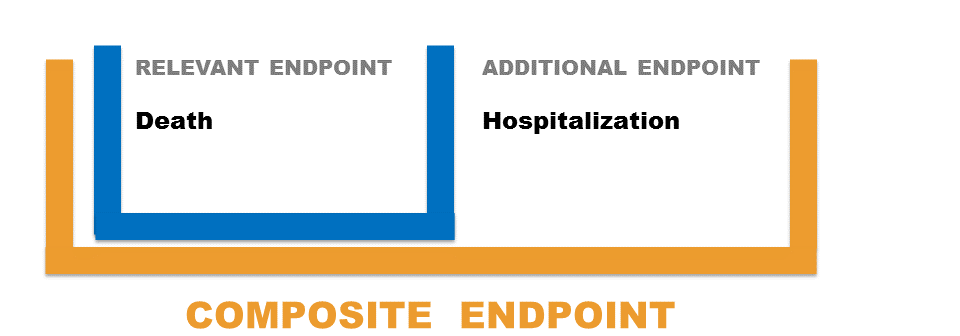
Relevant endpoint: the indispensable endpoint you must use in your trial to test the treatment efficacy.
Additional endpoint: secondary endpoint you might consider to add to test the treatment efficacy.
Composite endpoint: endpoint consisting of the union of the Relevant and the Additional endpoint.
Example
Suppose that the main objective of a randomized clinical trial is to assess the effects of the antioxidant Succinobucol in patients at elevate risk for cardiovascular events. Consider Death as the Relevant endpoint and Hospitalization as the Additional endpoint. The Composite is the union of Death and Hospitalization. Should you use Death as Primary endpoint or should you add Hospitalization and base the analysis on the Composite of Death + Hospitalization?
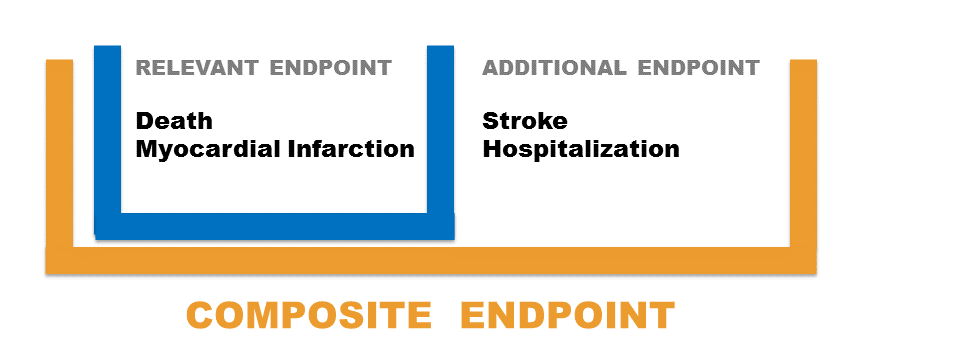
We could also consider other scenarios when both type of endpoints have several components:
Required information for CompARE
The following information is required to run CompARE:
- List of candidate endpoints, specifying whether they are Relevant or Additional.
- pR: Probability of observing the Relevant endpoint in the control group during the follow-up period.
- pA: Probability of observing the Additional endpoint in the control group during the follow-up period.
- HRR: Treatment effect between groups in terms of the Hazard Ratio of the Relevant endpoint. A HR < 1 indicates a beneficial effect of the treatment (compared to the control).
- HRA: Treatment effect between groups in terms of the Hazard Ratio of the Additional endpoint.
- ρ : Spearman's correlation between TR and TA (time until the occurrence of Relevant and the Additional endpoint, respectively). Since most of the times this information is unavailable, CompARE will produce plots for a range of ρ values.
When should I use a Composite as Primary endpoint?
Pros and cons on the use of Composite endpoints have been extensively discussed (Freemantle N. and Calvert M., 2003; Ferreira-González I. et al., 2007, among many others). One of the main advantages of using a Composite endpoint is that the problem of multiplicity is adequately addressed and the bias associated with competing risks is avoided (Wittkop L. et al., 2010). Although with a Composite endpoint the number of observed events will be higher, the power of the test will not be necessarily larger. Gómez and Lagakos (2013) discuss that adding inappropriate components to the Relevant endpoint might actually lead to a decrease in the power of the test statistic, consequently having a larger chance to fail in detecting a real effect of the treatment under study.
Gómez and Lagakos' methodology can be used to decide when it is more efficient to choose a Composite as Primary endpoint to evaluate the effect of a treatment. This is detailed in the next section.
Decision rule
The statistical method to help in the decision between using a Composite endpoint or one of its components as the Primary endpoint is based on the Asymptotic Relative Efficiency (ARE) from Gómez and Lagakos' (2013) paper. The ARE can be interpreted as the ratio of the required sample sizes to detect a specific treatment effect to attain the same power for a given significance level (Gómez G. and Gómez-Mateu M., 2014).
The primary endpoint of a clinical trial will be proposed as follows:
- When ARE > 1 : the Composite endpoint should be used.
- When ARE ≤ 1 : the Relevant endpoint should be used.
Accessing to CompARE application
You can access to CompARE using any standard web browser such as Mozilla Firefox, Internet Explorer or Google Chrome clicking on the following link: http://composite.upc.edu/CompAREYou need to be registered to run CompARE. To do so, go to the login link at the top page and click on 'Register'. You will need to introduce your e-mail to confirm the registration and get your password (all the information will be kept strictly confidential). Once you are registered, introduce your username and password.
Once logged in, click on "Start" to enter the application.
Running CompARE
Information about all the candidate endpoints
Enter the information about the endpoints you might plan to use as Primary endpoint in your Randomized Clinical Trial (see the screenshot):
- In the first column, write the name of each endpoint. Indicate whether the endpoint is terminating (when the occurrence of it precludes the observation of other endpoints, as for example Death). CompARE is not yet implemented for both Relevant and Additional endpoint including a terminating event (see Case 4 in Gómez and Lagakos' paper).
- Specify the expected probabilities of observing the event in the control group during the follow-up period. By default, when having several components of the Relevant or the Additional endpoints, CompARE will use the maximum probability of them. You can specify any other value at the Advanced information screen (see next subsection).
- Indicate the anticipated treatment effect in terms of the Hazard Ratios between groups. The Hazard Ratio is defined as the ratio of the hazard rates for each group. A Hazard Ratio < 1 indicates lower hazard rate from the treatment group. While the Hazard Ratio is assumed to be constant over time, hazard rates can me considered to increase o decrease over time (see Advanced features). By default, constant hazard rate is assumed. When having several components of the Relevant/Additional endpoints, CompARE will use the average Hazard Ratio. You can specify any other value at the Advanced features.
- Select whether the endpoint is a component of the Relevant or the Additional endpoint.
- In the last column, select those candidates that form the Composite endpoint. Unselected endpoints will be excluded from the current analysis.
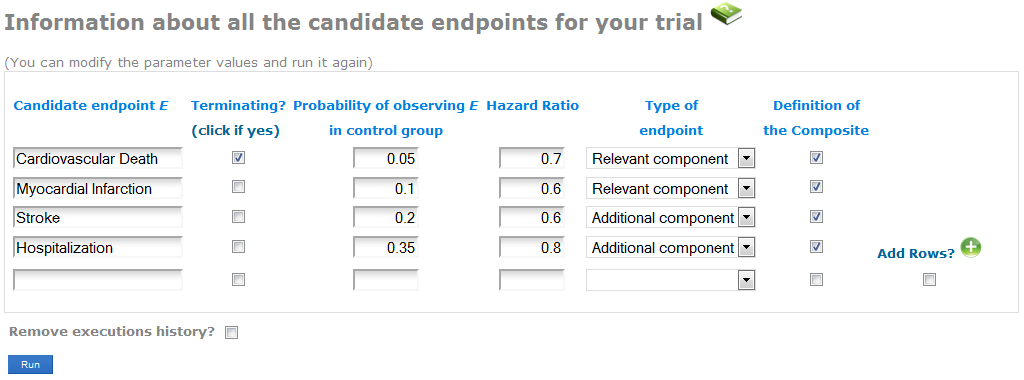
Note: Place the cursor over each header to get a quick definition.
- At the bottom, click on "Remove executions history" to delete previous analyses you may have done before.
- When ready, click on the "Run" button to execute the process.
Example (basic information of each candidate endpoint):
Consider we have the union of Cardiovascular Death + Myocardial Infarction as the Relevant endpoint, and the union of Stroke + Hospitalization as the Additional endpoint (see screenshot). Specify the expected probability and hazard ratio of each component. In the last column, select these four endpoints as components of the composite.
Advanced features (Optional)
Optionally, the user can specify the following information related to the Relevant and Additional endpoints (see screenshot):
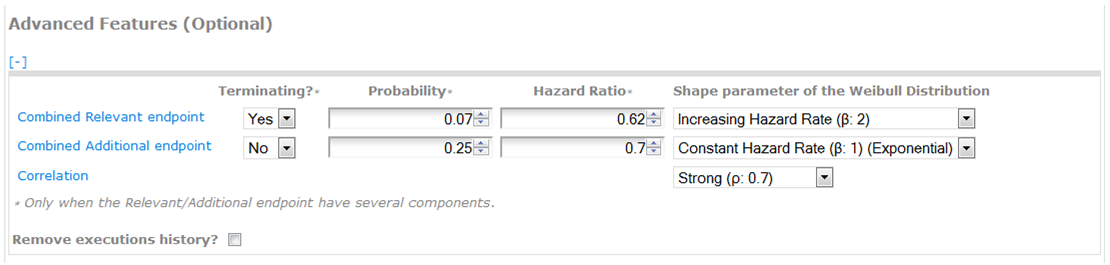
Combined Probability: it corresponds to the probability of the union of the components of the Relevant/Additional endpoint. By default, CompARE uses the maximum probability among its components. Only fill this information when having several components of the Relevant/Additional endpoint.
Combined Hazard Ratio: specify the treatment effect by means of the hazard ratio of the Relevant/Additional endpoint. By default, CompARE uses the average hazard ratio among its components. Only fill this information when having several components of the Relevant/Additional endpoint.
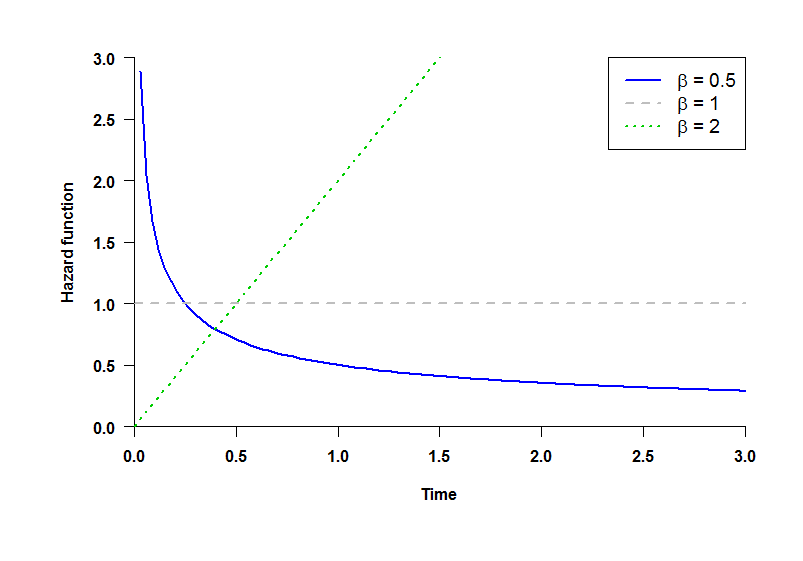
Shape parameter of the Weibull Distribution: distributions of TR and TA (time until the occurrence of Relevant and the Additional endpoint, respectively) follow a Weibull law with shape parameter β (see plot):
- β = 0.5: decreasing hazard rate.
- β = 1: constant hazard rate (Exponential distribution).
- β = 2: increasing hazard rate.
Note that the hazard rate is not the same as the Hazard Ratio, which is the ratio of the hazard rates for each group. While all the Hazard Ratios are assumed to be constant over time, hazard rates can be considered to increase (β = 2) or decrease (β = 0.5) over time.
Correlation: set the strength of correlation between TR and TA by means of Spearman's correlation coefficient (ρ) as follows:
- Very Strong (ρ = 0.9)
- Strong (ρ = 0.7)
- Moderate (ρ = 0.5)
- Weak (ρ = 0.3)
- Very Weak (ρ = 0.15)
- No correlation (ρ = 0)
Since most of the times this information is unavailable, CompARE will produce plots for a range of ρ values.
Example (advanced information of the Relevant/Additional endpoints):
Suppose that we know the combined probability and hazard ratio of the Relevant and the Additional endpoints (pR=0.07, pA=0.25, HRR=0.62, HRA=0.7) (see the screenshot). We can also consider increasing hazard rate for the Relevant endpoint and constant hazard rate for the Additional endpoint with a strong correlation between TR and TA (Relevant and Additional endpoint times).
Results
Once the program executes the computations, an output screen appears divided into four tags at the top:
- Results
- Other scenarios
- Graphical outputs
- Recorded results
In the first tag, a table specifies the parameter information set by the user together with the exact value of ARE. When ARE>1, the Composite endpoint should be used. That is, smaller sample size would be required. Otherwise, the Relevant endpoint will be advisable to use as Primary endpoint. The paragraph below shows a detailed recommendation (see figure).
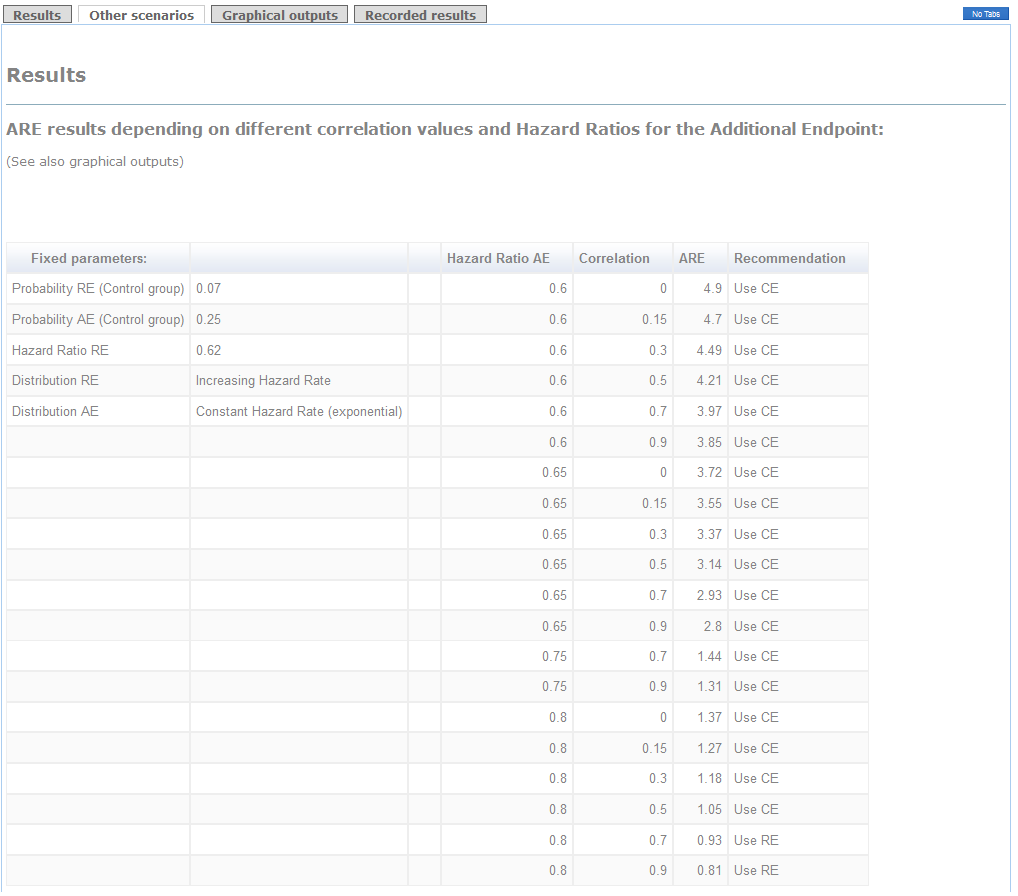
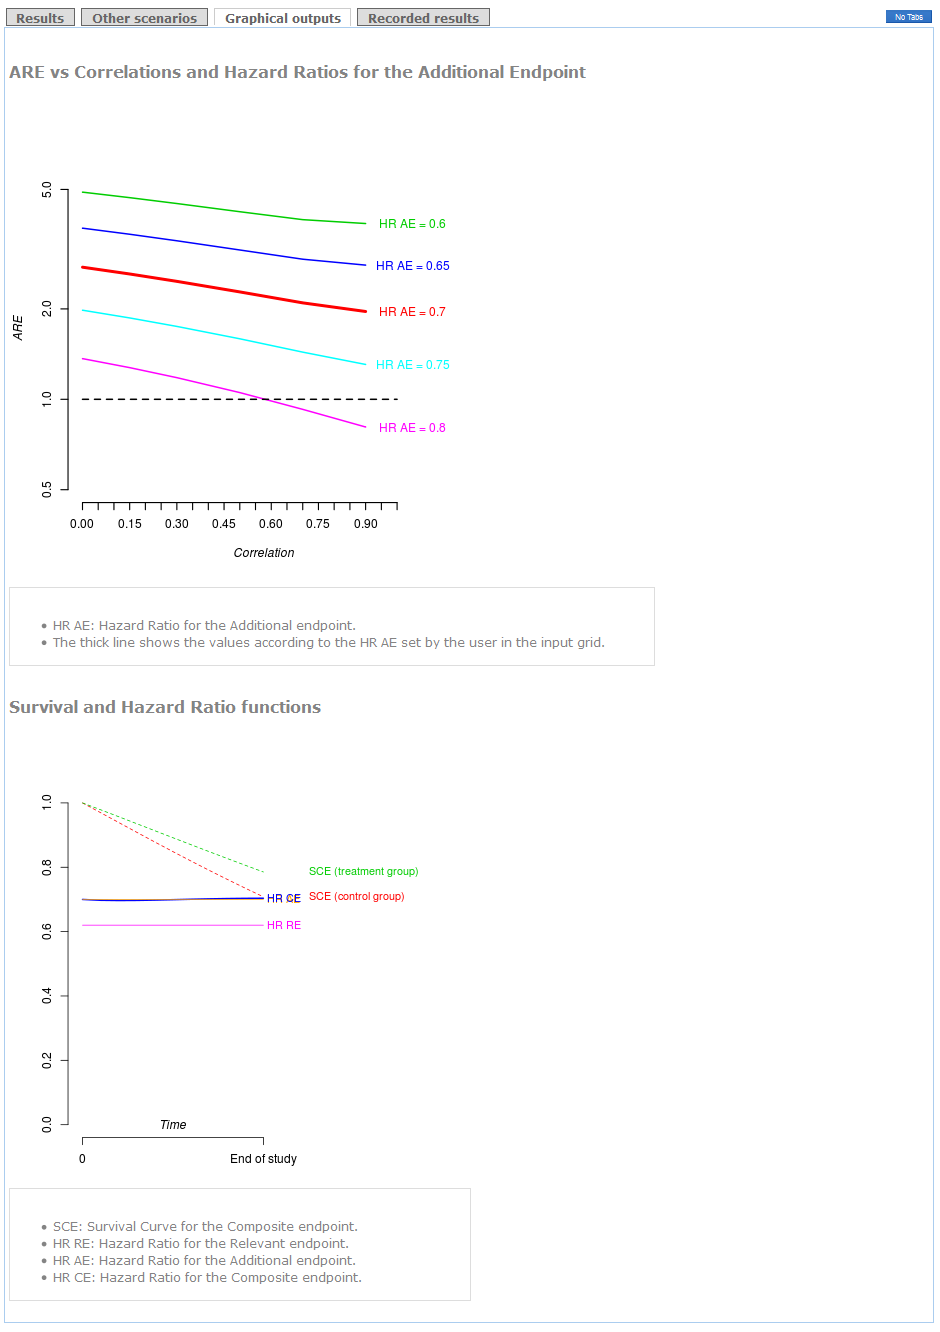
Other scenarios depending on different correlations and hazard ratios for the Additional endpoint are detailed in a table in "Other scenarios" tag.
These results can be shown graphically in the "plots" tag. Also a plot with survival distributions and hazard ratios is shown at the bottom. The "end of study" time point corresponds to the time to follow-up of your clinical trial.
In the last tag ("recorded results") the user can see the history of results done in previous analyses.
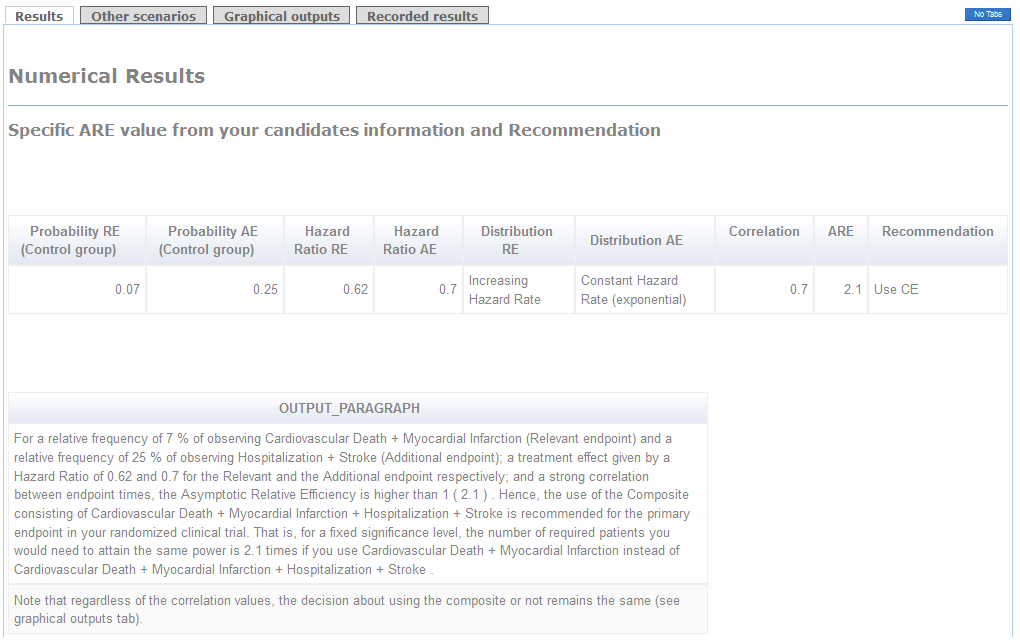

Example (conclusions):
The use of the Composite of Cardiovascular Death+Myocardial Infarction+Stroke+Hospitalization as primary endpoint is clearly advisable because the ARE is higher than 1 (see "Results" tag). Indeed, if you use the Relevant endpoint consisting of Cardiovascular Death+Myocardial Infarction as primary, you will need 2.1 times the required sample size to attain the same power (see Detailed Recommendations' box). Furthermore, regardless of the correlation between times, the recommendation of using the Composite endpoint remains the same (see the thick line in "graphical outputs" tag). The decision would be in favor of the Relevant endpoint in case you considered a hazard ratio for the Additional endpoint higher than 0.8 with a very strong correlation.
Future features of CompARE
- Sample size calculations: CompARE will use all the information provided by the probabilities and hazard ratios to compute the required sample size for a given significance level and power.
- Other copulas: choices of copulas rather than Frank's are being implemented (Plana-Ripoll and Gómez, 2014).
- Death in both Relevant and Additional endpoints: Case 4 in (Gómez and Lagakos, 2013) is being implemented and will be released soon.
- Binary outcomes: CompARE will incorporate decision rules whenever the endpoints for investigation are binary (dichotomous).
References
- Ferreira-González I, Permanyer-Miralda G, Busse JW, Bryant DM, Montori VM, Alonso-Coello P, Walter SD and Guyatt GH (2007). Methodologic discussions for using and interpreting composite endpoints are limited, but still identify major concerns. Journal of Clinical Epidemiology, 60, 651–657.
- Freemantle N, Calvert M, Wood J, Eastaugh J and Griffin C. (2003). Composite outcomes in Randomized Trials. Greater precision but with greater uncertainty? Journal of the American Medical Association, 289, 2554–2559.
- Gómez G. (2011). Some theoretical thoughts when using a composite endpoint to prove the efficacy of a treatment. International Workshop on Statistical Modelling. Proceedings of the 26th International Workshop on Statistical Modelling, València 14–21. Online http://hdl.handle.net/2117/22571
") .
.
- Gómez G, Gómez-Mateu M (2014). The Asymptotic Relative Efficiency and the ratio of sample sizes when testing two different null hypotheses. SORT, 38, 73-88.
- Gómez G, Gómez-Mateu M (2015). Comments on "Use of composite endpoints in clinical trials" by Abdul J. Sankoh, Haihong Li and Ralph B. D'Agostino, Sr. Statistics in Medicine (in print).
- Gómez G, Gómez-Mateu M, Dafni U (2014). Informed Choice of Composite Endpoints in Cardiovascular Trials. Circulation Cardiovascular and Quality Outcomes, 7, 170-178.
- Gómez G, Lagakos SW (2013). Statistical considerations when using a composite endpoint for comparing treatment groups. Statistics in Medicine, 32, 719–738.
- Montori VM, Permanyer-Miralda G, Ferreira-González I, Busse JW, Pacheco-Huergo V, Bryant D, Alonso J, Akl EA, Domingo-Salvany A, Mills E, Wu P, Schünemann HJ, Jaeschke R and Guyatt GH (2005). Validity of composite end points in clinical trials. British Medical Journal, 330, 594–596.
- Plana-Ripoll O, Gómez G (2014). Selecting the primary endpoint in a randomized clinical trial. The ARE method. (Submitted).
- Schoenfeld D. (1983). Sample-size formula for the proportional-hazards regression model. Biometrics 39, 499–503.
- Wittkop L, Smith C, Fox Z, Sabin C, Richert L, Aboulker JP, Phillips A, Chêne G, Babiker A and Thiébaut R. on behalf of NEAT-WP4. (2010). Methodological issues in the use of composite endpoints in clinical trials: examples from the HIV field. Clinical Trials, 7, 19–35.
